
 Adam Pichardo
Every scoping call I run has a moment where the owner asks some version of "okay, but what is this actually worth to me?" It is the right question. Most AI vendors answer it with a slide full of industry averages, which is the wrong answer, because your shop is not an industry average.
So here is how I answer it. I ask for four numbers the owner already knows or can pull in an afternoon, and we do the math on whatever is handy. It has been a napkin more than once. The formula is not sophisticated, and that is the point: if the return on an AI agent only shows up in a sophisticated model, it probably is not there.
Key Takeaways
| Point | Details |
|---|---|
| The napkin formula | Missed calls per week × close rate × average ticket × 52. That is your gross annual leak, and it is an upper bound. |
| The honest second pass | Multiply the leak by the share of missed calls that were real leads, then by a capture rate you choose as an assumption, not a fact. |
| Speed is the multiplier | HBR and MIT/InsideSales research shows lead contact and qualification odds fall hard after the first hour, and hardest after five minutes. A next-morning callback is not the same lead. |
| Capture rate is yours to pick | Nobody can tell you your capture rate before you run. Model a low and a high case and see whether the decision changes. |
| Do not count vanity | Calls answered, minutes handled, and texts sent are activity. Only booked, kept, paid work counts as return. |
| Payback is a division problem | Your build quote divided by recovered revenue per month. Then compare owning the rig against renting a seat, on more than price. |
What Is the Napkin Formula?
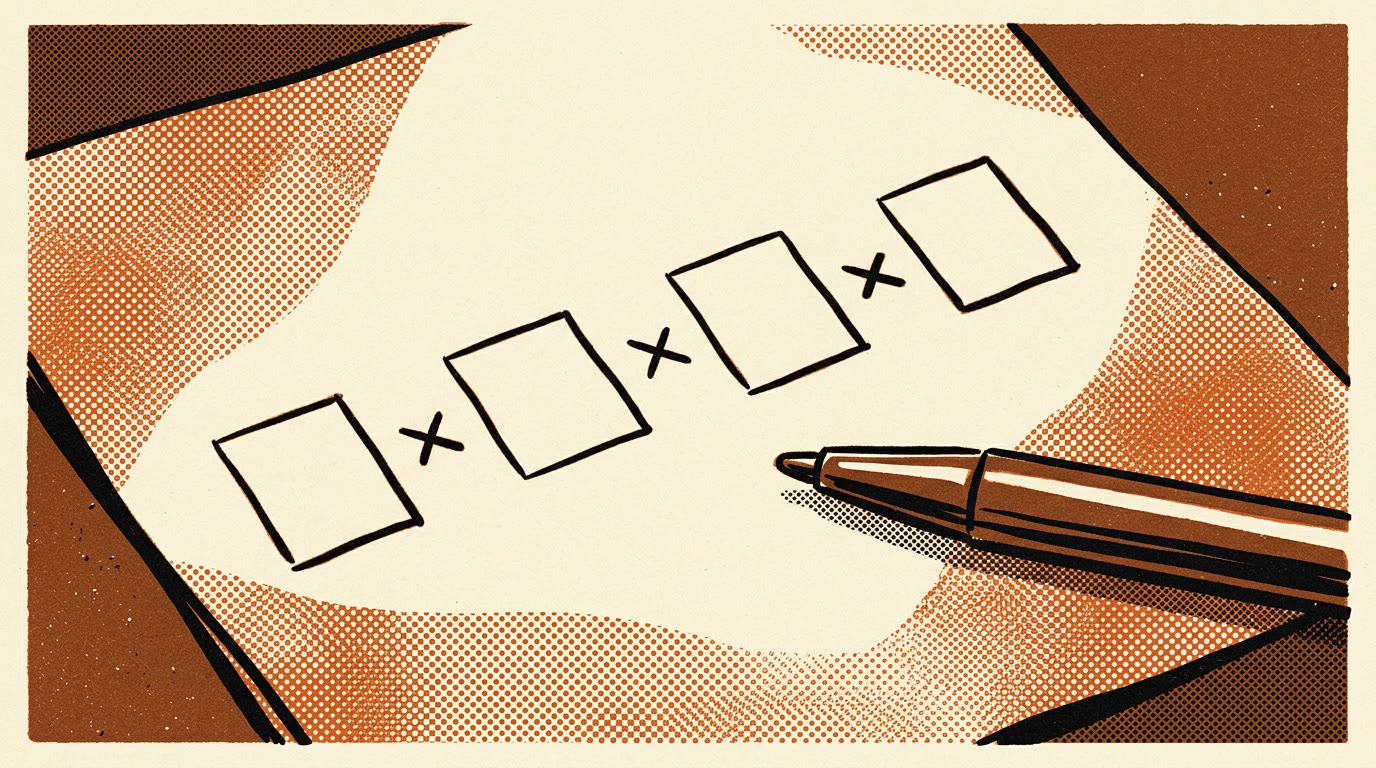
Four inputs. Write them down before you read further, even if you have to guess two of them.
- Missed calls per week. Rings that went to voicemail, rang out, or hit a busy signal. All of them, all hours.
- Close rate. Of the new-customer calls you do answer, what fraction becomes a booked job, a scheduled patient, or a sold unit? Your real number, not the one you would like.
- Average ticket. What one closed job is worth. First-visit revenue for a service business, first-year value for a practice, front-and-back gross for a dealership.
- 52. Weeks in a year. This one you do not have to guess.
Multiply them: missed calls per week × close rate × average ticket × 52 = gross annual leak.
That number is deliberately crude and deliberately too high. It assumes every missed call was a prospect and every prospect was recoverable, and neither is true. But it tells you whether this conversation is worth having at all. If the gross leak is a few thousand a year, an after-hours answering system is a nice-to-have and you can stop reading. If it is a meaningful slice of revenue, keep going, because the second pass is where it gets real.
The second napkin adds two honest multipliers:
Gross leak × lead share × capture rate = recovered revenue per year.
Lead share is the fraction of missed calls that were actually someone who wanted to buy something. Capture rate is the fraction of those the agent converts that you would otherwise have lost. Both get their own section below, because they are where the whole answer lives.
Where Do You Get Your Missed-Call Number?
Owners guess this one low, because you only notice the missed calls you happen to see. Pull it, do not guess it.
- Your phone system's call log. Any VoIP provider and most carrier business lines export calls by status. Filter for unanswered, busy, and voicemail. Pull two full weeks without a holiday.
- Your voicemail box. Count messages, then remember most people do not leave one. The voicemail count is a floor, not the number.
- Call tracking on your ads and site. If you run tracked numbers, that dashboard usually shows missed versus answered by hour of day, which is also the fastest way to get your after-hours share.
While you are in the log, tag each missed call by time of day, because after-hours calls behave differently (more on that in turning weekend missed calls into jobs). And write down how long your shop currently takes to return a missed call. The next section is about that number.
Why Does Response Time Change the Math?
Because a lead decays, fast, and the decay curve is the strongest argument for an agent that answers now versus a human who calls back later. Two pieces of research I trust on this.
The first is the 2011 Harvard Business Review piece "The Short Life of Online Sales Leads" by Oldroyd, McElheran, and Elkington. They audited 2,241 U.S. companies by submitting test web leads and timing the response. Firms that tried to contact a lead within an hour were nearly seven times as likely to qualify it as firms that waited even one hour more, and more than 60 times as likely as firms that waited 24 hours or longer. The average response time, among companies that responded within 30 days at all, was 42 hours. Twenty-three percent never responded. Only 37 percent got back inside an hour.
The second is the earlier 2007 Lead Response Management study by James Oldroyd, then a faculty fellow at MIT Sloan, using InsideSales.com call data: three years, six companies, more than 15,000 leads and 100,000 call attempts. The headline finding is that the odds of contacting a lead if called within 5 minutes versus 30 minutes drop 100 times, and the odds of qualifying it drop 21 times. It is vendor data with academic analysis, and it is web leads rather than phone calls, so treat the ratios as directional. The direction is not in dispute.
Now put that next to your own callback time. If your shop returns missed calls "usually the same day," you are working from the 60x-worse end of the curve, and most of the pass-one leak was never going to be recovered by calling back harder. The math changes when the answer happens at ring time. That is the thesis of speed to lead, and it is why I do not model an AI agent as a cheaper way to return calls. I model it as the only way to answer at minute zero, at 7:40pm, on a Sunday.
On the napkin this is a split: missed calls you already return within the hour go in with a discount, and calls you return the next morning, or never, go in at full weight. For most shops I meet, the second bucket is the bigger one.
What Capture Rate Should You Plug In?
Here is where I refuse to give you a number, and why. Capture rate is the fraction of real, missed leads the agent turns into a booked outcome you would not otherwise have gotten. It depends on things I cannot know from here: whether callers in your market hang up on an automated voice, whether the agent can put a job on the calendar or only take a message, how much of your after-hours demand is emergencies versus browsing. Anyone who says "our clients see 40 percent" before hearing your phone ring is quoting their best case as your forecast.
So plug it in as a range and run the napkin twice:
- Low case: 25 to 30 percent. The agent answers, some callers bail, the ones who stay get booked or texted, a few no-show. This is what I would assume for a voice-only build with no booking integration.
- High case: 50 to 60 percent. The agent books directly into your calendar, follows up by text if the call drops, and the caller needed something today. This is what a well-scoped build with a working missed-call text-back layer is aiming at.
Those are my scoping assumptions, not results I am claiming. What you do with them is check whether your decision changes between the cases. If the build makes sense at 25 percent, the argument is over. If it only makes sense at 60 percent, you are betting on a best case, and I would tell you so in the call.
Then, after go-live, replace the assumption with your real number. A forecast you never reconcile is a wish.
Three Worked Examples: HVAC, Dental, Dealership BDC
Three shops, three napkins. Every number here is a stated assumption I picked to be plausible for the trade, not a client result. Swap in your own and the arithmetic holds.
HVAC contractor, residential service
Assumptions: 12 missed calls a week across all hours, 60 percent are genuine service requests, the shop closes 55 percent of the service calls it does answer, and a first visit plus typical repair averages $600.
| Step | Math | Result |
|---|---|---|
| Gross leak (pass one) | 12 × 0.55 × $600 × 52 | $205,920 a year |
| Real leads only | × 0.60 lead share | $123,552 a year |
| Low capture (30%) | × 0.30 | $37,066 recovered |
| High capture (60%) | × 0.60 | $74,131 recovered |
Notice how far the honest number sits from the napkin number. A vendor who quotes you the $205,920 is selling you pass one. Make the decision on the $37,000 line. The HVAC after-hours page covers what that build looks like in the field.
Dental clinic, two chairs
Assumptions: 15 missed calls a week, mostly at lunch and after 5pm. Forty percent are new-patient inquiries (the rest are existing patients, counted separately). The office converts 60 percent of new-patient calls it answers, and a new patient is worth $700 in first-year revenue.
| Step | Math | Result |
|---|---|---|
| Gross leak (pass one) | 15 × 0.60 × $700 × 52 | $327,600 a year |
| Real leads only | × 0.40 lead share | $131,040 a year |
| Low capture (30%) | × 0.30 | $39,312 recovered |
| High capture (60%) | × 0.60 | $78,624 recovered |
Two things to poke at. The $700 is a first-year figure; lifetime patient value pushes it much higher, but you are financing a build with this year's cash, so keep it out of the napkin. And the existing-patient calls you did not count are not worthless, a missed call from a patient in pain is a retention risk. It just is not a lead, so it does not belong in a lead formula. The dental answering service page has the practice-specific version.
Car dealership BDC, one rooftop
Assumptions: 40 missed calls a week into the sales line, not unusual where the BDC goes home at 7pm and Saturday is chaos. Thirty-five percent are sales inquiries rather than service, parts, or wrong numbers. The store closes 12 percent of the sales calls it handles, and a sold unit is worth $1,900 in combined front and back gross.
| Step | Math | Result |
|---|---|---|
| Gross leak (pass one) | 40 × 0.12 × $1,900 × 52 | $474,240 a year |
| Real leads only | × 0.35 lead share | $165,984 a year |
| Low capture (25%) | × 0.25 | $41,496 recovered |
| High capture (50%) | × 0.50 | $82,992 recovered |
I set the dealership range lower on purpose. Car buyers shop several stores at once, so "answered first" is a bigger edge than in HVAC, but "booked" is a softer outcome: an appointment set is not a unit sold. If your BDC tracks show rate, multiply by it. The automotive answering page goes deeper on the after-hours sales line.
Three trades, three different ticket sizes and close rates, and the recovered range lands in the same neighborhood, because each shop leaks about a dozen real leads a week. The leak is the constant. The trade is just the exchange rate.
What Should You Not Count?
Most of what a vendor dashboard displays is designed to look like return and is not.
- Calls answered. Answering a call is a cost, not a result. A system that answers 400 calls a month and books nothing has run up minutes.
- Minutes handled, or hours saved. Unless you cut a shift or stopped paying by the minute, the saved hours did not turn into money. They turned into a nicer evening, which I value, but do not put on the napkin.
- Texts sent. Outbound volume. Count replies that led to a booking, not messages fired.
- Response time, conversation counts, sentiment scores. Necessary hygiene, not return. Responding in four seconds to a spam call is not revenue.
- Leads captured. The most seductive one. A name and number in the CRM is halfway. If the agent books an appointment and the customer no-shows, the return was zero.
The only thing that belongs in the numerator is booked work, kept and paid, that traces back to a call you would have missed. Everything else is instrumentation: useful for tuning the system, worthless for deciding whether to buy it.
How Do You Work Out Payback Period?
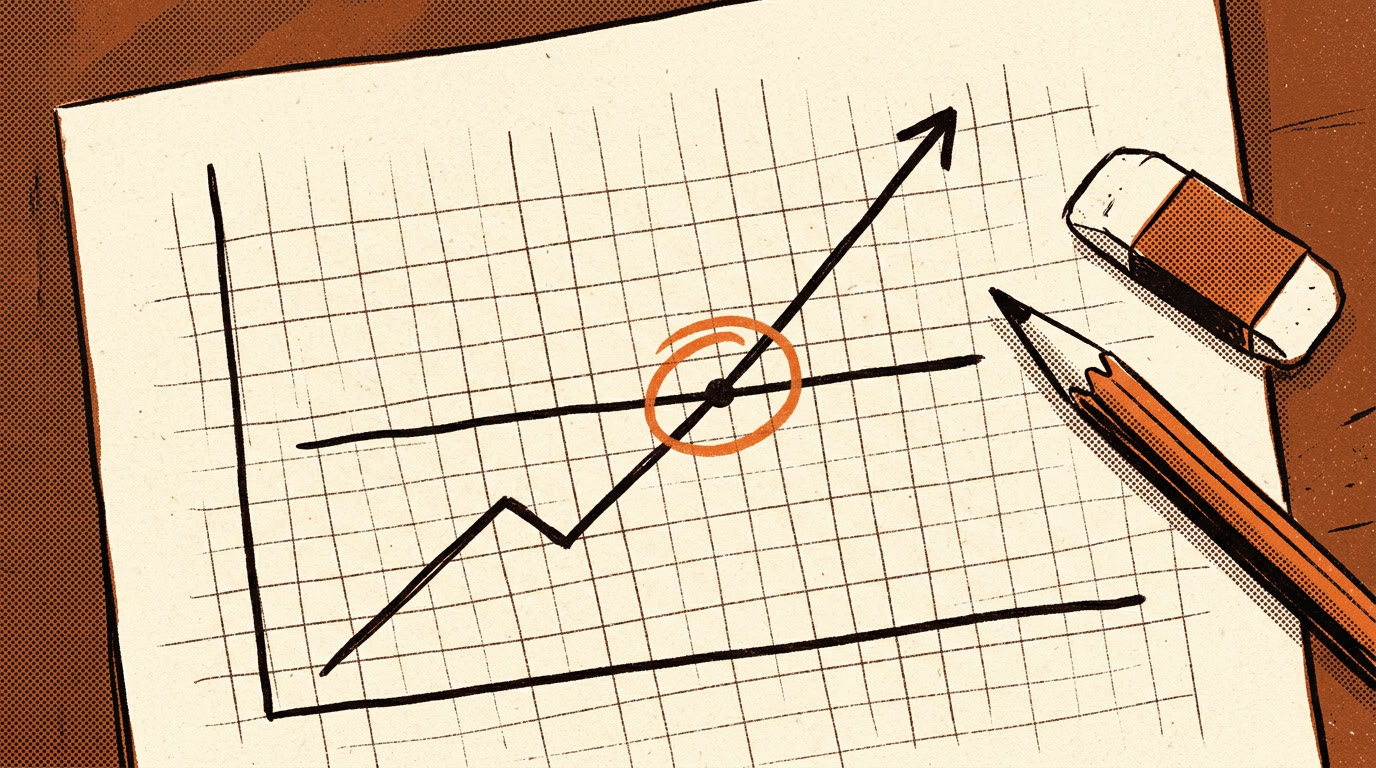
Take recovered revenue per year from the low case, divide by 12, and that is recovered revenue per month. Divide whatever the build costs by that figure. The answer is your payback period in months.
Payback months = build cost ÷ (recovered revenue per year ÷ 12).
In the HVAC low case, $37,066 a year is about $3,089 a month. Whatever your quote is, dividing it by roughly three thousand tells you how many months until the rig has paid for itself. Do it on the low case, and use margin rather than gross if you want to be strict: a job that grosses $600 and nets $250 pays back slower than the gross suggests.
Then there is the part of the comparison that does not fit on a napkin, which is what you are paying for. Two shapes on the market:
Renting a seat. A subscription to somebody's platform. Fast to start, and the bill runs forever. Your prompts, call logs, booking flow, and consent records live inside their account. If the price changes, you pay it. If the vendor pivots or gets acquired, the thing answering your phone changes underneath you, and if you cancel, it stops. The return you calculated has an expiry date someone else controls.
Owning the rig. A scoped build, a couple of weeks to live, and at the end you own the system: the code, the prompts, the data, the number, the integrations. The recurring piece is an optional managed plan for someone to keep it tuned and watch the logs, and you can decline it or bring it in-house. The payback math is the same division problem, but the return keeps running because the rig is yours.
I am not neutral here. I build the second one. But the honest argument is not that owning is always cheaper, it is that owning keeps the ROI you calculated as yours. So ask a fourth question under the payback line: in year three, who owns the thing generating this number? The custom build page explains how I scope that, and the demo lets you hear one answer a call before you decide anything.
Where Does the Math Lie?
Every formula this simple has soft spots. These are the ones I have watched bite people.
Seasonality. An HVAC shop that pulls two weeks of call logs in July is measuring its peak, not its year. Sample a slow fortnight and a busy one and average them, or pull twelve months if the system has it. A tax-refund March at a car store lies the same way.
Calls that were never leads. Lead share is the multiplier owners most want to skip, and skipping it is how a $37,000 answer becomes a $200,000 slide. Wrong numbers, vendors, existing customers, job applicants, and your own family all show up as "missed." Sample 50 voicemails and classify them. That is your lead share, and it is usually lower than you hoped.
Spam and robocalls. The YouMail Robocall Index put U.S. robocall volume at just under 3.9 billion in August 2026, about 125 million a day, with roughly half classified as telemarketing or scams. Business lines get their share. If your call log does not filter known-spam numbers, some of your "missed calls" were nobody, and an agent answering them is a cost line. Strip them before you count.
Callers you got anyway. Pass one treats every missed call as lost, but some people rang again an hour later, and your office already returns and closes a few. The agent's return is only the increment over that. Look for repeat numbers in the log and discount them, and keep the low case low.
Attribution after go-live. Once the agent is running, a job booked at 8pm looks like an obvious win, but was it a caller who would have tried again at 8am? Log each booking with its source and time, keep a short "would this have reached us otherwise" note for the first sixty days, and compare monthly booked-from-after-hours before and after. That reconciliation is the part nobody enjoys and the only part that makes the number true.
Do pass one to decide if the conversation is worth having. Do pass two to decide whether to build. Then throw the napkin away and count the real thing. If you want a second set of eyes on your four numbers, that is what the fifteen minutes below are for. Bring the call log.
Sources
- Oldroyd, McElheran, Elkington: "The Short Life of Online Sales Leads," Harvard Business Review, March 2011
- Oldroyd and Elkington: Lead Response Management Study executive summary (MIT / InsideSales.com, MarketingSherpa B2B Summit, October 2007)
- YouMail Robocall Index: U.S. Robocalls Drop 10% to Just Under 3.9 Billion in August 2026
The worked examples in this note use stated assumptions chosen to be plausible for each trade. They are not client results and should not be read as a forecast for any specific business.
FAQ
How Do You Calculate ROI on an AI Agent?
Start with the gross leak: missed calls per week × close rate × average ticket × 52. Then multiply by the share of missed calls that were real leads and by an assumed capture rate to get recovered revenue per year. Divide the build cost by recovered revenue per month for the payback period, and replace the assumed capture rate with your real one after sixty days of logs.
What Is a Realistic Capture Rate for an AI Answering Agent?
There is no universal number, and any figure quoted before someone has looked at your call log is their best case, not your forecast. Model a low case around 25 to 30 percent and a high case around 50 to 60 percent, check whether the decision changes between them, and then measure the real rate from booked, kept, paid work once the system is live.
Why Does Speed to Lead Matter for the ROI Math?
Because leads decay. The 2011 Harvard Business Review study of 2,241 companies found firms that responded within an hour were nearly seven times as likely to qualify a lead as those that waited an hour longer, and over 60 times as likely as those waiting 24 hours or more. The 2007 MIT/InsideSales study found contact odds drop 100 times between a 5-minute and a 30-minute response. A next-morning callback recovers far less of the leak than an answer at ring time.
What Metrics Should Not Count Toward AI Agent ROI?
Calls answered, minutes handled, texts sent, average response time, conversation counts, sentiment scores, and raw leads captured. These are activity metrics that help tune a system but do not prove return. Only booked work that was kept and paid, traced to a call you would otherwise have missed, belongs in the numerator.
How Do You Compare Renting an AI Agent to Owning One?
Run the same payback division for both, then ask who owns the system in year three. A rented seat stops producing return the day you cancel, and its prompts, logs, and consent records live in the vendor's account. An owned build keeps the code, data, number, and integrations with you, with an optional managed plan for upkeep, so the return you calculated stays yours.
Where Does Missed-Call ROI Math Go Wrong?
Sampling a peak season, counting calls that were never leads, counting spam and robocalls, ignoring callers who would have called back anyway, double-counting callbacks your office already made, and skipping attribution after go-live. Sample slow and busy weeks, classify a batch of voicemails for lead share, strip known spam, and reconcile bookings monthly against the forecast.